Population Pyramids
for Hall County Growth Model
Table of Contents
About Population Pyramids
Population Pyramids
- Hall County
- Hispanic Population
- Non-Hispanic Population
- Mexico
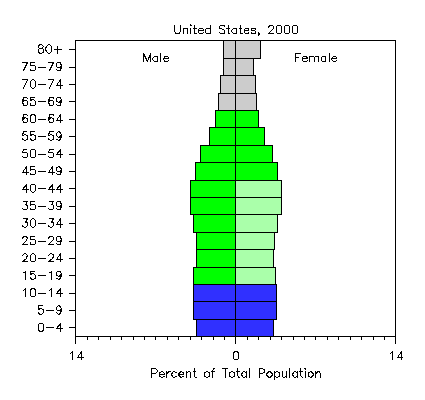
- United States
About Population Pyramids
Population pyramids are graphs that display the age and gender composition of a population.
These graphs typically arrange male counts or percentages on the left
and female counts or percentages on the right.
Age groups are shown by stacking bars with the youngest age group on the bottom.
Most populations have a positive natural growth rate which displays, roughly, as a pyramid, hence
the common name of population pyramid.
The advantage of using counts in a time series of population pyramids for one population
is that you see the size of the population change. The disadvantage of using counts is that you
cannot easily compare pyramids from different populations.
The population pyramids on these pages use percentages rather than counts to draw the horizontally stacked bars
because this growth model compares population pyramids of
Hall County, Mexico, and the United States.
Color is used to denote some common population blocks
used in demographic studies. The population 65 years of age and older is
assumed to be no longer economically productive and is shown in grey.
Blue is used for dependent children of 14 years of age and younger.
The population between 15 and 64 years
of age is assumed to be economically productive and is shown in green.
Females between 15 and 44 years of age are assumed to be of child
bearing age and are shown in light green.
Population pyramids are used to show changing population structures.
A population with a large natural growth rate will have a pronounced
pyramid shape with a wide base. As a replacement or zero natural growth
rate and a low death rate evolve, over 60 years or so, a silo shape is described.
A population with a negative natural growth rate will have smaller
bars at the base of the pyramid.
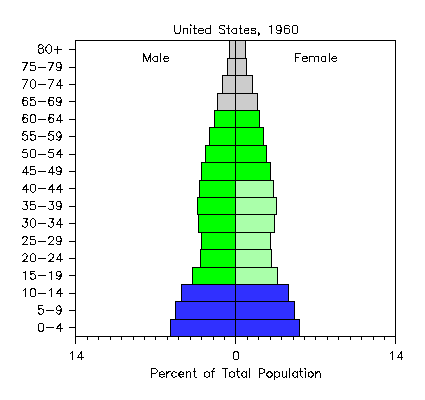
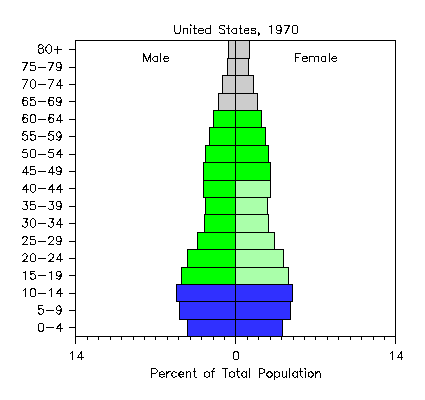
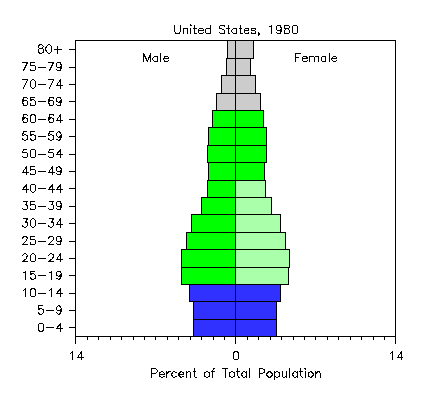
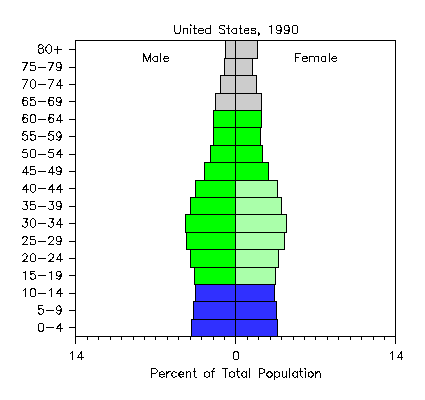
The post World War II baby boom in the United States, and its echo,
show as a bulge in the pyramid that moves up the pyramid over time.
The characteristic male laborer bias of an immigrant labor population
appears in the male bars being larger than the female bars.
MetaMedia, Inc. wrote a software program in Python to generate
both the population pyramids and the html in which to present them.
That software is made available under the GNU General Public License
and can be found here.
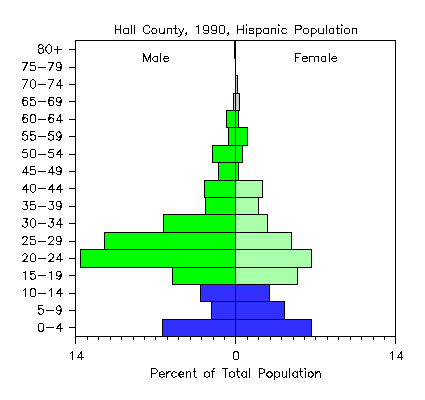
Hall County, 1990, Hispanic Population
|
|
| Age Group | Male | Female | Total
|
|---|
| Count | Percent | Count | Percent | Count | Percent
|
|---|
| 80+ | 5 | 0.1 | 0 | 0.0 | 5 | 0.1
|
|---|
| 75-79 | 3 | 0.1 | 0 | 0.0 | 3 | 0.1
|
|---|
| 70-74 | 0 | 0.0 | 7 | 0.2 | 7 | 0.2
|
|---|
| 65-69 | 10 | 0.2 | 14 | 0.3 | 24 | 0.6
|
|---|
| 60-64 | 34 | 0.8 | 9 | 0.2 | 43 | 1.1
|
|---|
| 55-59 | 27 | 0.7 | 42 | 1.0 | 69 | 1.7
|
|---|
| 50-54 | 82 | 2.0 | 23 | 0.6 | 105 | 2.6
|
|---|
| 45-49 | 61 | 1.5 | 8 | 0.2 | 69 | 1.7
|
|---|
| 40-44 | 111 | 2.8 | 95 | 2.4 | 206 | 5.1
|
|---|
| 35-39 | 107 | 2.7 | 80 | 2.0 | 187 | 4.6
|
|---|
| 30-34 | 257 | 6.4 | 111 | 2.8 | 368 | 9.1
|
|---|
| 25-29 | 463 | 11.5 | 196 | 4.9 | 659 | 16.3
|
|---|
| 20-24 | 548 | 13.6 | 267 | 6.6 | 815 | 20.2
|
|---|
| 15-19 | 225 | 5.6 | 219 | 5.4 | 444 | 11.0
|
|---|
| 10-14 | 126 | 3.1 | 119 | 2.9 | 245 | 6.1
|
|---|
| 5-9 | 87 | 2.2 | 172 | 4.3 | 259 | 6.4
|
|---|
| 0-4 | 260 | 6.4 | 266 | 6.6 | 526 | 13.0
|
|---|
| Total | 2406 | 59.6 | 1628 | 40.4 | 4034 | 100.0
|
|---|
|
U.S. Bureau of the Census, 2000 Census
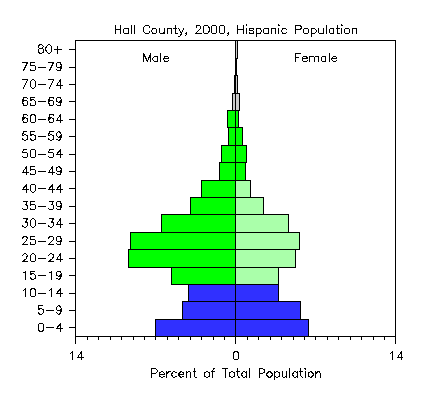
Hall County, 2000, Hispanic Population
|
|
| Age Group | Male | Female | Total
|
|---|
| Count | Percent | Count | Percent | Count | Percent
|
|---|
| 80+ | 10 | 0.0 | 26 | 0.1 | 36 | 0.1
|
|---|
| 75-79 | 22 | 0.1 | 6 | 0.0 | 28 | 0.1
|
|---|
| 70-74 | 38 | 0.1 | 45 | 0.2 | 83 | 0.3
|
|---|
| 65-69 | 89 | 0.3 | 76 | 0.3 | 165 | 0.6
|
|---|
| 60-64 | 197 | 0.7 | 66 | 0.2 | 263 | 1.0
|
|---|
| 55-59 | 183 | 0.7 | 156 | 0.6 | 339 | 1.2
|
|---|
| 50-54 | 337 | 1.2 | 249 | 0.9 | 586 | 2.1
|
|---|
| 45-49 | 402 | 1.5 | 222 | 0.8 | 624 | 2.3
|
|---|
| 40-44 | 830 | 3.0 | 353 | 1.3 | 1183 | 4.3
|
|---|
| 35-39 | 1091 | 4.0 | 665 | 2.4 | 1756 | 6.4
|
|---|
| 30-34 | 1788 | 6.5 | 1252 | 4.6 | 3040 | 11.1
|
|---|
| 25-29 | 2517 | 9.2 | 1530 | 5.6 | 4047 | 14.8
|
|---|
| 20-24 | 2579 | 9.4 | 1435 | 5.3 | 4014 | 14.7
|
|---|
| 15-19 | 1533 | 5.6 | 1008 | 3.7 | 2541 | 9.3
|
|---|
| 10-14 | 1123 | 4.1 | 1028 | 3.8 | 2151 | 7.9
|
|---|
| 5-9 | 1269 | 4.6 | 1545 | 5.7 | 2814 | 10.3
|
|---|
| 0-4 | 1914 | 7.0 | 1734 | 6.3 | 3648 | 13.4
|
|---|
| Total | 15922 | 58.3 | 11396 | 41.7 | 27318 | 100.0
|
|---|
|
U.S. Bureau of the Census, 2000 Census
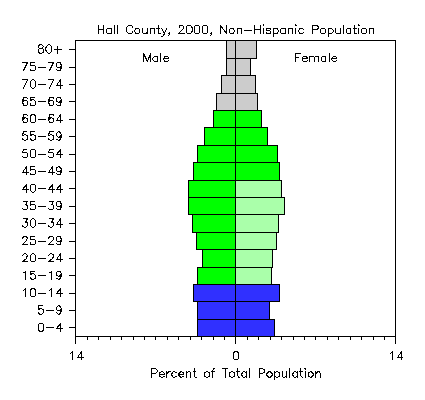
Hall County, 2000, Non-Hispanic Population
|
|
| Age Group | Male | Female | Total
|
|---|
| Count | Percent | Count | Percent | Count | Percent
|
|---|
| 80+ | 904 | 0.8 | 2058 | 1.8 | 2962 | 2.6
|
|---|
| 75-79 | 956 | 0.9 | 1470 | 1.3 | 2426 | 2.2
|
|---|
| 70-74 | 1426 | 1.3 | 1929 | 1.7 | 3355 | 3.0
|
|---|
| 65-69 | 1900 | 1.7 | 2110 | 1.9 | 4010 | 3.6
|
|---|
| 60-64 | 2210 | 2.0 | 2515 | 2.2 | 4725 | 4.2
|
|---|
| 55-59 | 3037 | 2.7 | 3078 | 2.7 | 6115 | 5.5
|
|---|
| 50-54 | 3777 | 3.4 | 4027 | 3.6 | 7804 | 7.0
|
|---|
| 45-49 | 4186 | 3.7 | 4248 | 3.8 | 8434 | 7.5
|
|---|
| 40-44 | 4644 | 4.1 | 4493 | 4.0 | 9137 | 8.2
|
|---|
| 35-39 | 4680 | 4.2 | 4764 | 4.3 | 9444 | 8.4
|
|---|
| 30-34 | 4240 | 3.8 | 4213 | 3.8 | 8453 | 7.6
|
|---|
| 25-29 | 3842 | 3.4 | 3964 | 3.5 | 7806 | 7.0
|
|---|
| 20-24 | 3315 | 3.0 | 3617 | 3.2 | 6932 | 6.2
|
|---|
| 15-19 | 3774 | 3.4 | 3524 | 3.1 | 7298 | 6.5
|
|---|
| 10-14 | 4150 | 3.7 | 4279 | 3.8 | 8429 | 7.5
|
|---|
| 5-9 | 3781 | 3.4 | 3259 | 2.9 | 7040 | 6.3
|
|---|
| 0-4 | 3808 | 3.4 | 3781 | 3.4 | 7589 | 6.8
|
|---|
| Total | 54630 | 48.8 | 57329 | 51.2 | 111959 | 100.0
|
|---|
|
U.S. Bureau of the Census, 2000 Census
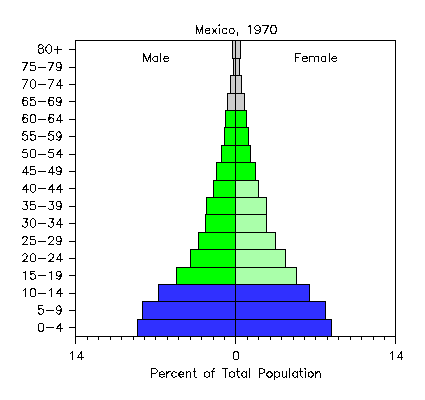
Mexico, 1970
|
|
| Age Group | Male | Female | Total
|
|---|
| Count | Percent | Count | Percent | Count | Percent
|
|---|
| 80+ | 152208 | 0.3 | 195713 | 0.4 | 347921 | 0.7
|
|---|
| 75-79 | 119571 | 0.2 | 133077 | 0.3 | 252648 | 0.5
|
|---|
| 70-74 | 242008 | 0.5 | 246245 | 0.5 | 488253 | 1.0
|
|---|
| 65-69 | 345379 | 0.7 | 357184 | 0.7 | 702563 | 1.5
|
|---|
| 60-64 | 451069 | 0.9 | 466784 | 1.0 | 917853 | 1.9
|
|---|
| 55-59 | 501529 | 1.0 | 510330 | 1.1 | 1011859 | 2.1
|
|---|
| 50-54 | 589788 | 1.2 | 602255 | 1.2 | 1192043 | 2.5
|
|---|
| 45-49 | 829719 | 1.7 | 807299 | 1.7 | 1637018 | 3.4
|
|---|
| 40-44 | 959477 | 2.0 | 973863 | 2.0 | 1933340 | 4.0
|
|---|
| 35-39 | 1235283 | 2.6 | 1276364 | 2.6 | 2511647 | 5.2
|
|---|
| 30-34 | 1285461 | 2.7 | 1310802 | 2.7 | 2596263 | 5.4
|
|---|
| 25-29 | 1575414 | 3.3 | 1685004 | 3.5 | 3260418 | 6.8
|
|---|
| 20-24 | 1930300 | 4.0 | 2102041 | 4.4 | 4032341 | 8.4
|
|---|
| 15-19 | 2491047 | 5.2 | 2563344 | 5.3 | 5054391 | 10.5
|
|---|
| 10-14 | 3271115 | 6.8 | 3125059 | 6.5 | 6396174 | 13.3
|
|---|
| 5-9 | 3934729 | 8.2 | 3788267 | 7.9 | 7722996 | 16.0
|
|---|
| 0-4 | 4151517 | 8.6 | 4015993 | 8.3 | 8167510 | 16.9
|
|---|
| Total | 24065614 | 49.9 | 24159624 | 50.1 | 48225238 | 100.0
|
|---|
|
Dirección General de Estradistica
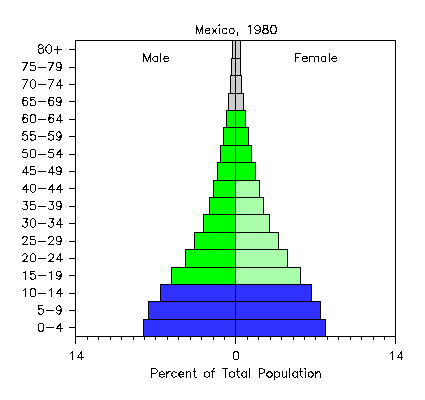
Mexico, 1980
|
|
| Age Group | Male | Female | Total
|
|---|
| Count | Percent | Count | Percent | Count | Percent
|
|---|
| 80+ | 220707 | 0.3 | 281820 | 0.4 | 502527 | 0.7
|
|---|
| 75-79 | 243640 | 0.4 | 264358 | 0.4 | 507998 | 0.7
|
|---|
| 70-74 | 326582 | 0.5 | 356078 | 0.5 | 682660 | 1.0
|
|---|
| 65-69 | 420249 | 0.6 | 456260 | 0.7 | 876509 | 1.3
|
|---|
| 60-64 | 543237 | 0.8 | 580263 | 0.8 | 1123500 | 1.6
|
|---|
| 55-59 | 733426 | 1.1 | 754614 | 1.1 | 1488040 | 2.2
|
|---|
| 50-54 | 919382 | 1.3 | 937765 | 1.4 | 1857147 | 2.7
|
|---|
| 45-49 | 1137562 | 1.7 | 1168158 | 1.7 | 2305720 | 3.4
|
|---|
| 40-44 | 1368082 | 2.0 | 1410311 | 2.1 | 2778393 | 4.0
|
|---|
| 35-39 | 1614905 | 2.4 | 1679251 | 2.4 | 3294156 | 4.8
|
|---|
| 30-34 | 1951308 | 2.8 | 2032869 | 3.0 | 3984177 | 5.8
|
|---|
| 25-29 | 2460607 | 3.6 | 2564412 | 3.7 | 5025019 | 7.3
|
|---|
| 20-24 | 3021314 | 4.4 | 3123826 | 4.5 | 6145140 | 8.9
|
|---|
| 15-19 | 3845733 | 5.6 | 3910978 | 5.7 | 7756711 | 11.3
|
|---|
| 10-14 | 4533249 | 6.6 | 4537991 | 6.6 | 9071240 | 13.2
|
|---|
| 5-9 | 5268289 | 7.7 | 5087600 | 7.4 | 10355889 | 15.1
|
|---|
| 0-4 | 5566749 | 8.1 | 5364033 | 7.8 | 10930782 | 15.9
|
|---|
| Total | 34175021 | 49.8 | 34510587 | 50.2 | 68685608 | 100.0
|
|---|
|
U.S. Bureau of the Census, International Data Base
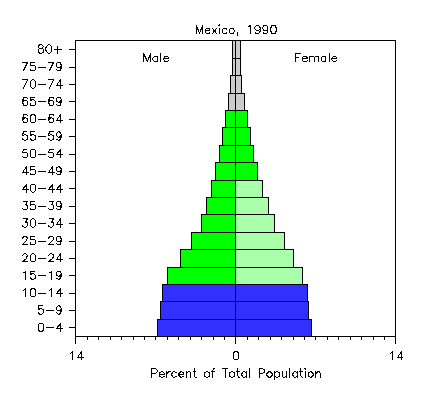
Mexico, 1990
|
|
| Age Group | Male | Female | Total
|
|---|
| Count | Percent | Count | Percent | Count | Percent
|
|---|
| 80+ | 245620 | 0.3 | 322814 | 0.4 | 568434 | 0.7
|
|---|
| 75-79 | 243581 | 0.3 | 302556 | 0.4 | 546137 | 0.6
|
|---|
| 70-74 | 377668 | 0.4 | 445451 | 0.5 | 823119 | 1.0
|
|---|
| 65-69 | 573330 | 0.7 | 633544 | 0.8 | 1206874 | 1.4
|
|---|
| 60-64 | 774798 | 0.9 | 832248 | 1.0 | 1607046 | 1.9
|
|---|
| 55-59 | 1004374 | 1.2 | 1074668 | 1.3 | 2079042 | 2.5
|
|---|
| 50-54 | 1240035 | 1.5 | 1326313 | 1.6 | 2566348 | 3.0
|
|---|
| 45-49 | 1479756 | 1.8 | 1595672 | 1.9 | 3075428 | 3.6
|
|---|
| 40-44 | 1785958 | 2.1 | 1935455 | 2.3 | 3721413 | 4.4
|
|---|
| 35-39 | 2179172 | 2.6 | 2399706 | 2.8 | 4578878 | 5.4
|
|---|
| 30-34 | 2541524 | 3.0 | 2839708 | 3.4 | 5381232 | 6.4
|
|---|
| 25-29 | 3274261 | 3.9 | 3563281 | 4.2 | 6837542 | 8.1
|
|---|
| 20-24 | 4107875 | 4.9 | 4260617 | 5.0 | 8368492 | 9.9
|
|---|
| 15-19 | 5083374 | 6.0 | 4951226 | 5.9 | 10034600 | 11.9
|
|---|
| 10-14 | 5441759 | 6.4 | 5259972 | 6.2 | 10701731 | 12.7
|
|---|
| 5-9 | 5597552 | 6.6 | 5395925 | 6.4 | 10993477 | 13.0
|
|---|
| 0-4 | 5791894 | 6.9 | 5564726 | 6.6 | 11356620 | 13.4
|
|---|
| Total | 41742531 | 49.4 | 42703882 | 50.6 | 84446413 | 100.0
|
|---|
|
U.S. Bureau of the Census, International Data Base
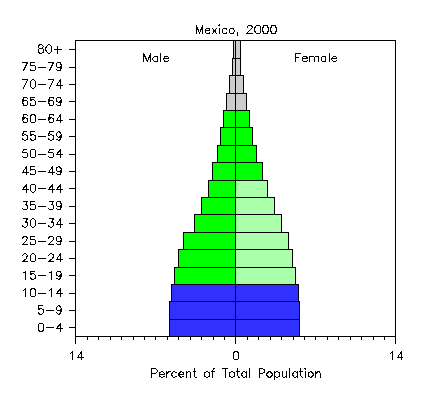
Mexico, 2000
|
|
| Age Group | Male | Female | Total
|
|---|
| Count | Percent | Count | Percent | Count | Percent
|
|---|
| 80+ | 252290 | 0.3 | 390106 | 0.4 | 642396 | 0.6
|
|---|
| 75-79 | 329799 | 0.3 | 427262 | 0.4 | 757061 | 0.8
|
|---|
| 70-74 | 545173 | 0.5 | 652243 | 0.6 | 1197416 | 1.2
|
|---|
| 65-69 | 800588 | 0.8 | 921400 | 0.9 | 1721988 | 1.7
|
|---|
| 60-64 | 1067034 | 1.1 | 1199742 | 1.2 | 2266776 | 2.3
|
|---|
| 55-59 | 1333567 | 1.3 | 1491497 | 1.5 | 2825064 | 2.8
|
|---|
| 50-54 | 1651575 | 1.6 | 1845241 | 1.8 | 3496816 | 3.5
|
|---|
| 45-49 | 2039867 | 2.0 | 2311117 | 2.3 | 4350984 | 4.3
|
|---|
| 40-44 | 2382562 | 2.4 | 2741621 | 2.7 | 5124183 | 5.1
|
|---|
| 35-39 | 3012835 | 3.0 | 3401594 | 3.4 | 6414429 | 6.4
|
|---|
| 30-34 | 3676060 | 3.7 | 3988283 | 4.0 | 7664343 | 7.6
|
|---|
| 25-29 | 4569510 | 4.6 | 4620288 | 4.6 | 9189798 | 9.2
|
|---|
| 20-24 | 5060476 | 5.0 | 4999288 | 5.0 | 10059764 | 10.0
|
|---|
| 15-19 | 5429831 | 5.4 | 5269542 | 5.3 | 10699373 | 10.7
|
|---|
| 10-14 | 5690111 | 5.7 | 5478661 | 5.5 | 11168772 | 11.1
|
|---|
| 5-9 | 5799842 | 5.8 | 5573938 | 5.6 | 11373780 | 11.3
|
|---|
| 0-4 | 5816595 | 5.8 | 5580228 | 5.6 | 11396823 | 11.4
|
|---|
| Total | 49457715 | 49.3 | 50892051 | 50.7 | 100349766 | 100.0
|
|---|
|
U.S. Bureau of the Census, International Data Base
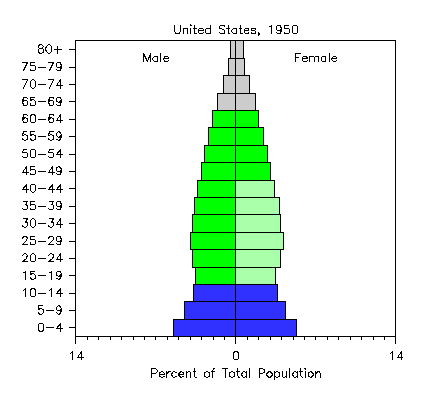
United States, 1950
|
|
| Age Group | Male | Female | Total
|
|---|
| Count | Percent | Count | Percent | Count | Percent
|
|---|
| 80+ | 761000 | 0.5 | 989000 | 0.6 | 1750000 | 1.1
|
|---|
| 75-79 | 1005000 | 0.7 | 1150000 | 0.8 | 2155000 | 1.4
|
|---|
| 70-74 | 1644000 | 1.1 | 1800000 | 1.2 | 3444000 | 2.3
|
|---|
| 65-69 | 2447000 | 1.6 | 2602000 | 1.7 | 5049000 | 3.3
|
|---|
| 60-64 | 3058000 | 2.0 | 3045000 | 2.0 | 6103000 | 4.0
|
|---|
| 55-59 | 3656000 | 2.4 | 3637000 | 2.4 | 7293000 | 4.8
|
|---|
| 50-54 | 4149000 | 2.7 | 4162000 | 2.7 | 8311000 | 5.5
|
|---|
| 45-49 | 4566000 | 3.0 | 4576000 | 3.0 | 9142000 | 6.0
|
|---|
| 40-44 | 5121000 | 3.4 | 5169000 | 3.4 | 10290000 | 6.8
|
|---|
| 35-39 | 5585000 | 3.7 | 5762000 | 3.8 | 11347000 | 7.5
|
|---|
| 30-34 | 5733000 | 3.8 | 5942000 | 3.9 | 11675000 | 7.7
|
|---|
| 25-29 | 6071000 | 4.0 | 6291000 | 4.1 | 12362000 | 8.1
|
|---|
| 20-24 | 5794000 | 3.8 | 5886000 | 3.9 | 11680000 | 7.7
|
|---|
| 15-19 | 5381000 | 3.5 | 5294000 | 3.5 | 10675000 | 7.0
|
|---|
| 10-14 | 5707000 | 3.7 | 5506000 | 3.6 | 11213000 | 7.4
|
|---|
| 5-9 | 6811000 | 4.5 | 6564000 | 4.3 | 13375000 | 8.8
|
|---|
| 0-4 | 8362000 | 5.5 | 8048000 | 5.3 | 16410000 | 10.8
|
|---|
| Total | 75851000 | 49.8 | 76423000 | 50.2 | 152274000 | 100.0
|
|---|
|
U.S. Bureau of the Census, International Data Base
United States, 1960
|
|
| Age Group | Male | Female | Total
|
|---|
| Count | Percent | Count | Percent | Count | Percent
|
|---|
| 80+ | 1039000 | 0.6 | 1502000 | 0.8 | 2541000 | 1.4
|
|---|
| 75-79 | 1370000 | 0.8 | 1711000 | 0.9 | 3081000 | 1.7
|
|---|
| 70-74 | 2197000 | 1.2 | 2577000 | 1.4 | 4774000 | 2.6
|
|---|
| 65-69 | 2936000 | 1.6 | 3344000 | 1.9 | 6280000 | 3.5
|
|---|
| 60-64 | 3414000 | 1.9 | 3741000 | 2.1 | 7155000 | 4.0
|
|---|
| 55-59 | 4145000 | 2.3 | 4326000 | 2.4 | 8471000 | 4.7
|
|---|
| 50-54 | 4763000 | 2.6 | 4901000 | 2.7 | 9664000 | 5.3
|
|---|
| 45-49 | 5379000 | 3.0 | 5535000 | 3.1 | 10914000 | 6.0
|
|---|
| 40-44 | 5732000 | 3.2 | 5946000 | 3.3 | 11678000 | 6.5
|
|---|
| 35-39 | 6140000 | 3.4 | 6403000 | 3.5 | 12543000 | 6.9
|
|---|
| 30-34 | 5904000 | 3.3 | 6079000 | 3.4 | 11983000 | 6.6
|
|---|
| 25-29 | 5423000 | 3.0 | 5512000 | 3.1 | 10935000 | 6.1
|
|---|
| 20-24 | 5569000 | 3.1 | 5566000 | 3.1 | 11135000 | 6.2
|
|---|
| 15-19 | 6803000 | 3.8 | 6640000 | 3.7 | 13443000 | 7.4
|
|---|
| 10-14 | 8602000 | 4.8 | 8323000 | 4.6 | 16925000 | 9.4
|
|---|
| 5-9 | 9565000 | 5.3 | 9245000 | 5.1 | 18810000 | 10.4
|
|---|
| 0-4 | 10339000 | 5.7 | 10002000 | 5.5 | 20341000 | 11.3
|
|---|
| Total | 89320000 | 49.4 | 91353000 | 50.6 | 180673000 | 100.0
|
|---|
|
U.S. Bureau of the Census, International Data Base
United States, 1970
|
|
| Age Group | Male | Female | Total
|
|---|
| Count | Percent | Count | Percent | Count | Percent
|
|---|
| 80+ | 1379000 | 0.7 | 2363000 | 1.2 | 3742000 | 1.8
|
|---|
| 75-79 | 1573000 | 0.8 | 2298000 | 1.1 | 3871000 | 1.9
|
|---|
| 70-74 | 2322000 | 1.1 | 3145000 | 1.5 | 5467000 | 2.7
|
|---|
| 65-69 | 3139000 | 1.5 | 3887000 | 1.9 | 7026000 | 3.4
|
|---|
| 60-64 | 4052000 | 2.0 | 4624000 | 2.3 | 8676000 | 4.2
|
|---|
| 55-59 | 4781000 | 2.3 | 5225000 | 2.5 | 10006000 | 4.9
|
|---|
| 50-54 | 5380000 | 2.6 | 5786000 | 2.8 | 11166000 | 5.4
|
|---|
| 45-49 | 5873000 | 2.9 | 6277000 | 3.1 | 12150000 | 5.9
|
|---|
| 40-44 | 5847000 | 2.9 | 6148000 | 3.0 | 11995000 | 5.8
|
|---|
| 35-39 | 5475000 | 2.7 | 5680000 | 2.8 | 11155000 | 5.4
|
|---|
| 30-34 | 5716000 | 2.8 | 5872000 | 2.9 | 11588000 | 5.7
|
|---|
| 25-29 | 6821000 | 3.3 | 6915000 | 3.4 | 13736000 | 6.7
|
|---|
| 20-24 | 8655000 | 4.2 | 8547000 | 4.2 | 17202000 | 8.4
|
|---|
| 15-19 | 9816000 | 4.8 | 9517000 | 4.6 | 19333000 | 9.4
|
|---|
| 10-14 | 10622000 | 5.2 | 10230000 | 5.0 | 20852000 | 10.2
|
|---|
| 5-9 | 10152000 | 5.0 | 9768000 | 4.8 | 19920000 | 9.7
|
|---|
| 0-4 | 8751000 | 4.3 | 8415000 | 4.1 | 17166000 | 8.4
|
|---|
| Total | 100354000 | 48.9 | 104697000 | 51.1 | 205051000 | 100.0
|
|---|
|
U.S. Bureau of the Census, International Data Base
United States, 1980
|
|
| Age Group | Male | Female | Total
|
|---|
| Count | Percent | Count | Percent | Count | Percent
|
|---|
| 80+ | 1714857 | 0.8 | 3512053 | 1.5 | 5226910 | 2.3
|
|---|
| 75-79 | 1862070 | 0.8 | 2967762 | 1.3 | 4829832 | 2.1
|
|---|
| 70-74 | 2871581 | 1.3 | 3969654 | 1.7 | 6841235 | 3.0
|
|---|
| 65-69 | 3915788 | 1.7 | 4893691 | 2.1 | 8809479 | 3.9
|
|---|
| 60-64 | 4697364 | 2.1 | 5445314 | 2.4 | 10142678 | 4.5
|
|---|
| 55-59 | 5478072 | 2.4 | 6133480 | 2.7 | 11611552 | 5.1
|
|---|
| 50-54 | 5617519 | 2.5 | 6078434 | 2.7 | 11695953 | 5.1
|
|---|
| 45-49 | 5376515 | 2.4 | 5676899 | 2.5 | 11053414 | 4.9
|
|---|
| 40-44 | 5757209 | 2.5 | 5989589 | 2.6 | 11746798 | 5.2
|
|---|
| 35-39 | 6960677 | 3.1 | 7159824 | 3.1 | 14120501 | 6.2
|
|---|
| 30-34 | 8836010 | 3.9 | 8974414 | 3.9 | 17810424 | 7.8
|
|---|
| 25-29 | 9888501 | 4.3 | 9903993 | 4.3 | 19792494 | 8.7
|
|---|
| 20-24 | 10884885 | 4.8 | 10705064 | 4.7 | 21589949 | 9.5
|
|---|
| 15-19 | 10779171 | 4.7 | 10386201 | 4.6 | 21165372 | 9.3
|
|---|
| 10-14 | 9313212 | 4.1 | 8923123 | 3.9 | 18236335 | 8.0
|
|---|
| 5-9 | 8491414 | 3.7 | 8110939 | 3.6 | 16602353 | 7.3
|
|---|
| 0-4 | 8414215 | 3.7 | 8036969 | 3.5 | 16451184 | 7.2
|
|---|
| Total | 110859060 | 48.7 | 116867403 | 51.3 | 227726463 | 100.0
|
|---|
|
U.S. Bureau of the Census, International Data Base
United States, 1990
|
|
| Age Group | Male | Female | Total
|
|---|
| Count | Percent | Count | Percent | Count | Percent
|
|---|
| 80+ | 2216639 | 0.9 | 4779267 | 1.9 | 6995906 | 2.8
|
|---|
| 75-79 | 2410587 | 1.0 | 3736312 | 1.5 | 6146899 | 2.5
|
|---|
| 70-74 | 3423852 | 1.4 | 4601200 | 1.8 | 8025052 | 3.2
|
|---|
| 65-69 | 4514045 | 1.8 | 5564943 | 2.2 | 10078988 | 4.0
|
|---|
| 60-64 | 4950422 | 2.0 | 5673137 | 2.3 | 10623559 | 4.2
|
|---|
| 55-59 | 5007095 | 2.0 | 5471368 | 2.2 | 10478463 | 4.2
|
|---|
| 50-54 | 5527276 | 2.2 | 5851738 | 2.3 | 11379014 | 4.5
|
|---|
| 45-49 | 6787984 | 2.7 | 7047592 | 2.8 | 13835576 | 5.5
|
|---|
| 40-44 | 8803466 | 3.5 | 9015201 | 3.6 | 17818667 | 7.1
|
|---|
| 35-39 | 9959860 | 4.0 | 10086530 | 4.0 | 20046390 | 8.0
|
|---|
| 30-34 | 10995366 | 4.4 | 11026456 | 4.4 | 22021822 | 8.8
|
|---|
| 25-29 | 10790793 | 4.3 | 10610850 | 4.2 | 21401643 | 8.6
|
|---|
| 20-24 | 9904862 | 4.0 | 9417991 | 3.8 | 19322853 | 7.7
|
|---|
| 15-19 | 9148333 | 3.7 | 8660551 | 3.5 | 17808884 | 7.1
|
|---|
| 10-14 | 8817261 | 3.5 | 8395802 | 3.4 | 17213063 | 6.9
|
|---|
| 5-9 | 9254039 | 3.7 | 8823148 | 3.5 | 18077187 | 7.2
|
|---|
| 0-4 | 9650341 | 3.9 | 9207587 | 3.7 | 18857928 | 7.5
|
|---|
| Total | 122162221 | 48.8 | 127969673 | 51.2 | 250131894 | 100.0
|
|---|
|
U.S. Bureau of the Census, International Data Base
United States, 2000
|
|
| Age Group | Male | Female | Total
|
|---|
| Count | Percent | Count | Percent | Count | Percent
|
|---|
| 80+ | 3093305 | 1.1 | 6158663 | 2.2 | 9251968 | 3.3
|
|---|
| 75-79 | 3051227 | 1.1 | 4374151 | 1.5 | 7425378 | 2.6
|
|---|
| 70-74 | 3904321 | 1.4 | 4945625 | 1.8 | 8849946 | 3.1
|
|---|
| 65-69 | 4402844 | 1.6 | 5131111 | 1.8 | 9533955 | 3.4
|
|---|
| 60-64 | 5165703 | 1.8 | 5699027 | 2.0 | 10864730 | 3.8
|
|---|
| 55-59 | 6553207 | 2.3 | 7005944 | 2.5 | 13559151 | 4.8
|
|---|
| 50-54 | 8706996 | 3.1 | 9083620 | 3.2 | 17790616 | 6.3
|
|---|
| 45-49 | 9959477 | 3.5 | 10271081 | 3.6 | 20230558 | 7.2
|
|---|
| 40-44 | 11179973 | 4.0 | 11355395 | 4.0 | 22535368 | 8.0
|
|---|
| 35-39 | 11304995 | 4.0 | 11343359 | 4.0 | 22648354 | 8.0
|
|---|
| 30-34 | 10372884 | 3.7 | 10214189 | 3.6 | 20587073 | 7.3
|
|---|
| 25-29 | 9785399 | 3.5 | 9531418 | 3.4 | 19316817 | 6.8
|
|---|
| 20-24 | 9821860 | 3.5 | 9363203 | 3.3 | 19185063 | 6.8
|
|---|
| 15-19 | 10412689 | 3.7 | 9837270 | 3.5 | 20249959 | 7.2
|
|---|
| 10-14 | 10560818 | 3.7 | 10047597 | 3.6 | 20608415 | 7.3
|
|---|
| 5-9 | 10488829 | 3.7 | 9994277 | 3.5 | 20483106 | 7.3
|
|---|
| 0-4 | 9831175 | 3.5 | 9386999 | 3.3 | 19218174 | 6.8
|
|---|
| Total | 138595702 | 49.1 | 143742929 | 50.9 | 282338631 | 100.0
|
|---|
|
U.S. Bureau of the Census, International Data Base
Copyright (c) 2003
by MetaMedia, Inc.
All Rights Reserved
|
|